Research Report
Stop FUNDING our DEMISE!
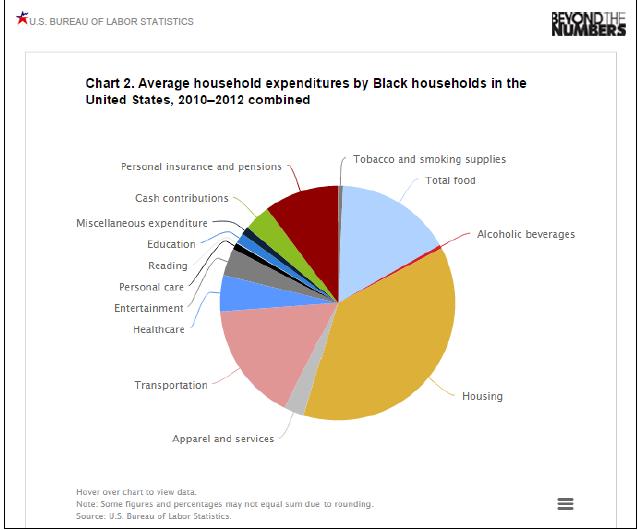
Housing and Related Charges 33% Education 14%
Food 13%
Cars and Trucks - New & Used 6% Apparel Products and Services 5% Health Care 5%
Insurance 4%
Telephone Services 3%
Households Furnishings & Equip 3% Contributions 2%
Media 2%
Personal Care Products and Services 1% Travel, Transportation and Lodging 1% Consumer Electronics 1% Miscellaneous 1%
Computers 1%
Gifts 1%
Beverages (Non-Alcoholic) 1%
Tobacco Products/Smoking Supplies 1% Beverages (Alcoholic) 1%
Entertainment and Leisure 1%
Toys Games and Pets 0%
Appliances 0%
Sports and Recreational Equipment 0% Housewares 0%
Books 0%
TOTAL SPENDING 100%
Source: US Bureau of Labor Statistics
a Necessities
"Necessities represent the food, shelter and clothing individuals need to maintain a certain quality of life."
b Non-durable goods
"Non-durable goods last less than three years; these include gasoline, paper products and office supplies."
c Durable goods
"Cars and houses are examples of durable goods, which last more than three years."
d Luxury items
"Luxury items include jewelry, high-priced cars and other items not necessary for living a standard lifestyle."
"...Significant changes to consumer spending in durable and luxury goods can be an important economic indicator. Consumer spending increases in these two categories usually represent individuals with higher income. Conversely, spending decreases may indicate lower individual income or consumer confidence. These spending categories can help businesses and governments determine if consumer spending is expanding or contracting based on the number of purchases."







 RSS Feed

